Analysis: Slow attacks generate most goals but they are not the strongest weapon of winners – 29.08.2018

What situations in floorball happen over and over again?
From which type of offensive plays are goals scored?
How do these plays evolve?
Similar questions are asked by coaches and by fans of the game. We ask them as well. With data analysis and thanks to Český Florbal we all can reveal some answers together. Aim of this analysis is to better understand floorball at even strength situations (5 on 5, 4 on 4 and 3 on 3). It works with shot attempts that are generated from four different types of offensive plays. These are here defined:
Slow attack = offensive play in which one team advances slowly to the offensive half.
53% of shot attempts are generated from slow attack and 47% of all goals are scored like that.
Turnover = offensive play that starts with a turnover on the offensive half.
16% of shot attempts are generated from turnover and 19% of all goals are scored this way.
Breakaway = quick offensive play in which ball is transitioned fast from the defensive half to the offensive one (also turnovers starting in the defensive half are included, these are often called counter attacks). Odd man rushes fall in this category but also quick attacks such as 2 on 2 are included here.
15% of all shot attempts are generated from breakaway and 28% of all goals are scored like that.
Free hit = shot attempts generated from and after free hit.
16% of all shot attempts are generated from free hit and 6% of all goals are scored like that.
More than every second shot attempt is created from slow attack. Almost half of all goals are scored from this type of offensive play. It makes sense to study these situations. Should we study them the most though? Turnovers and in particular breakaways register higher shooting percentage. We must dig deeper in the analysis.
We can better explain this higher shooting percentage from turnovers and breakaways when studying locations from which shot attempts are generated (left side in the picture below), block share (middle) and shooting percentage (right side).
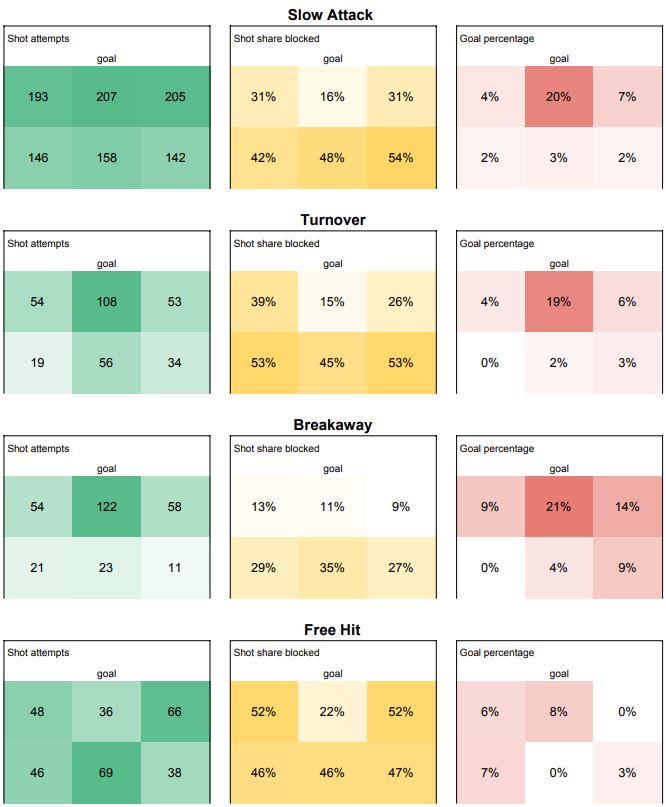
Twelve “Boxes” in the picture represent the offensive half of floorball field.
We can summarize the main points here:
Strength of turnover and breakaway lies in ability of offense to create a shot attempt from a good scoring position (mainly from in close)
Strength of breakaways is connected to the fact that defense is not able to block many shot attempts
In both offensive plays positions of all players is usually favourable for offense because defense is not formed well. After turnover defense can at least block shot attempts in a good share but not in breakaway situations. Defense is often not compact, there are space gaps between players and goals are scored more often from wings (that are not defended well)
Shooting percentage of slow attack situations and turnovers are almost equal but the difference is that it is easier to create shots from in close in case of turnovers
We know from what type of offensive plays goals are scored the most. We also know why.
What we still don´t know is what type of offensive plays are connected to winning?
And how these situations are generated in a game?
We can get closer to answer the first question with following analysis. Let´s ask following question. In what ratios are winners able to outshoot their opponent concerning different types of offensive plays?
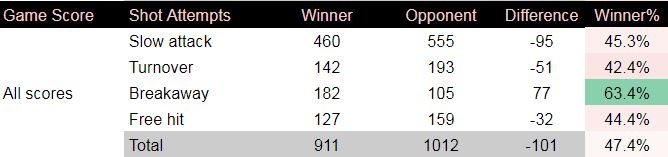
Table above indicates that the winner does not generate more shot attempts than opponent (winner generates 47% of all shot attempts in total). Winners do not generate more shot attempts from turnovers (share of only 42%, partly explained by checking style of a team that trails in score) and slow attacks (45%) than opponents. Winners record a significant advantage in shot attempts from breakaway with 63% share!
More goals are scored from slow attacks but having more breakaways can win games. But can this advantage be created only when winner is leading the game, defends and just produces breakaways? We can check this hypothesis by dividing the dataset to situations when winner is trailing or the score is close (tied or winner is leading by one in first two periods) and when winner is leading (by two goals or by one in the third period).
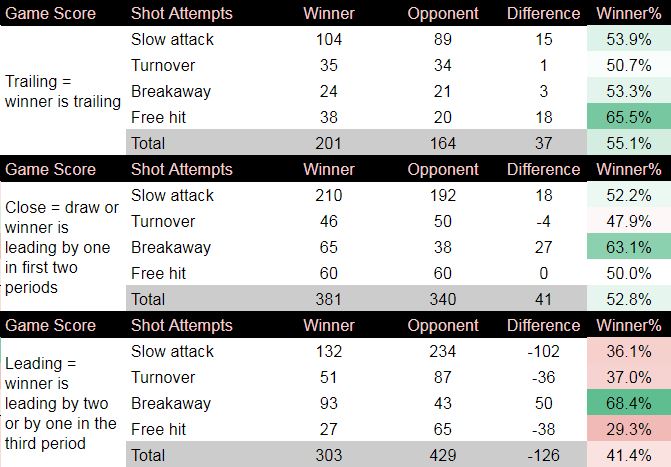
When looking at the very right column we see that game score influences shot attempt generation. Winners create more shot attempts than opponent when trailing (55%) but create much less when leading (41%). With breakaways we see similar trend. Winners have 53% of all breakaway shot attempts when trailing, 63% when score is close and 68% when leading. These are all positive (above 50%) results and this still significant factor of winners.
Ability to generate breakaways can be one of the dominant strategies in floorball nowadays. Teams should pay attention and should ask how can they generate breakaways for and prevent breakaways against. Strength of breakaways lie in a surprise for defense that is usually not formed and is not able to block shots against. This sure correlates to a combination of spatial variables: position - time - space. Where is the play located, in which position players are, where is the ball, how much time the player with a ball and others have on their decisions and what spatial options the player has (for a pass, finish or advancing with the ball)? Spatial analysis has a potential to reveal detailed structures within the game. So far we depend mainly on coaches, experts and players themselves.
Specifics and limitations of the analysis
There are 1967 shot attempts included from the year 2015
Dataset includes games from Tipsport Superliga (Czech elite league), 1st Men league (Czech second best league) and international games
Limited data sample - statistically goal is a rare event and so in order to fulfill traditional values of statistical significance we need much bigger sample size. The aim is to just find a direction for floorball and created and base for its analysis
Analysis works with shot attempts only. There are offensive plays that result in no finish but they are dangerous. There are also offensive plays in which the player has not much of a chance to score but still decides to shoot. For further work I plan to introduce data that will correspond to quality of each possession and not only outputs of offensive plays (shot attempts)
Petr Malina
News
21 - 40 / 146


Latvia Overcomes Norway after Penalty Shootout – 8.12.2018
Data Analysis: Czech Republic vs Denmark 10-1 – 8.12.2018
DAY 8: Battles for Final Start, Quarterfinal Losers to Fight for Fifth Place – 8.12.2018
Day 7 Summary: Favorites Sail through to Semis, Championship Again Offers Fantastic Atmosphere – 8.12.2018
Slovakia Takes 9th Place after Exciting Victory over Estonia – 7.12.2018
Finland Becomes Last Semifinalist after 6-1 Win against Germany – 7.12.2018
Canada Edges out Australia Thanks to Huge Comeback in Third Period – 7.12.2018
Sweden Advances to Semifinals after Beating Latvia – 7.12.2018
Poland Outclasses Thailand 9-1 to Grab 13th Place – 7.12.2018
Takizawa Scores Twice as Japan Beats Singapore 4-2 to Take 15th Place – 7.12.2018
Data Analysis: Group Stage Summary – 7.12.2018
DAY 7: Two Quarterfinals and Final Placement Matches on Schedule – 7.12.2018
Day 6 Summary: Czechs Easily through, Switzerland Stumbles, Attendance Record Broken – 7.12.2018
New WFC Attendance record – 6.12.2018
Data Analysis: Sweden vs Denmark 25-0 – 6.12.2018
Czech Republic Comfortably Wins Over Denmark to Reach Semifinals – 6.12.2018
Estonia Outclasses Canada 9-2 to Face Slovakia in 9th Place Game – 6.12.2018
Switzerland Gets Past Norway in Overtime Drama – 6.12.2018
Slovakia Beats Australia 12-3, Will Fight for 9th Place Tomorrow – 6.12.2018
Data Analysis: Norway vs Finland 1-9 – 6.12.2018