Data Analysis: Finland in pure control over Czechs – 01.09.2018
Data Analysis is a pretty new area in floorball but as the sport is growing quickly analyzing data from the game is trying to catch up.
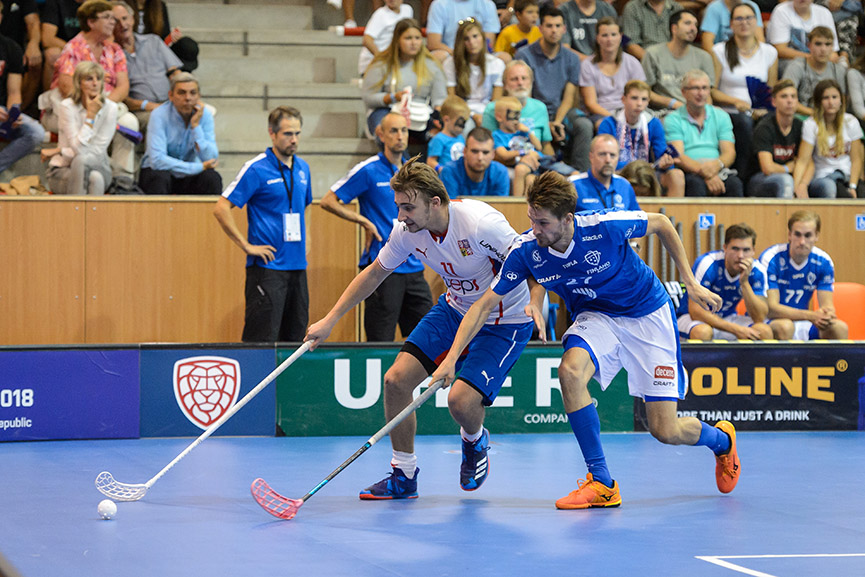
This article attempts to summarize and explain what happened during the recent Euro Floorball Tour men game between the Czech republic and Finland (ended by score of 0-4) by using the data and its analysis.
Aim of the analysis should be searching for measurable variables of the game that are linked to winning therefore are relevant to observe. Statistics such as goals, shots on goals or blocked shots do not bring reliable information to cover the game closely.
In this analysis we shift our focus to measure both quantity and also quality of each possession in the game. This approach should serve as a fundamental piece in understanding modern floorball.
Let´s take it slowly in this article. First of all we need to all understand what are the definitions of used variables.
Possession = every possession of a ball for one team; possession changes when defending team steals the ball, type of attack changes (e.g. from quick attack to slow attack), the ball is deflected to open space, goal is scored or period finishes
Slow attack (SA) = possession type in which attacking team advances with the ball slowly
Quick attack (QA) = possession type in which attacking team transitions the ball forward in a quick fashion
Turnover (TO) = possession that starts with a steal on offensive half of the pitch for attacking team
No attack (NA) = possession in which the team with the ball does not attack
Clear path (CP) = situation in which an offensive player is left open with a clear path to the net in a dangerous area in front of the goal; can be executed (the player receives the ball in a good scoring opportunity) or observed (the ball never comes to the player)
Cross field pass (CF) = situation in which an offensive team has an opening for a cross field pass on offensive half of the pitch; can be executed (pass is received) or observed (never attempted opening or failed attempt)
Odd man rush (OMR) = situation in which the attacking offense outnumbers the defence
Why these? It took more than two years to study what variables in floorball seems to be relevant for successful teams. We did measure isolated variables such as detailed shot attempts, turnovers, ability of keeping the ball in offense and other details for players. Measuring type and quality of possessions seems to be the way of analyzing the game now. There will be an article on this.
Okay, let´s look at the game by numbers. Why the title? Shot attempts in the game were 40-45 for Finland. Czechs should have scored more than zero goals so why the clear verdict? Finland was much stronger in relevant aspects of the game. Look at the first comparison.

Czech team was able to generate little more slow attacks (51-46) but had less quick attacks (18-24) and turnover possessions (6-7). Overall we can not see much explained by this. We shift our focus to quality of these possessions.

Ability to create clear path opportunities for shooters, odd-man rushes and also ability to create cross field pass openings are these of our interest. From the graph above we clearly see that Finland was able to outnumber the Czech team 14-26 in terms of clear path opportunities. Finland also created more odd man rushes (7-12) and had much more cross field pass openings (10-25). These are all quality aspects of good teams. Lastly on team level look at execution shares of some situations.

Again, Finland dominated the game. There were able to execute a high share of clear paths (65%). I will comment on last two columns. 7-12 was a score of odd man rush opportunities in the game. Czechs were able only in two (makes 29% of a share) occasions to generate clear path to the net, Fins created 8 (makes 67% of a share) clear paths in these situations. That is a quality difference.
Modern floorball is not decided on quantity of shot attempts as well as possessions but quality of them.
Lastly we can dig into players performances looking from the same perspective.
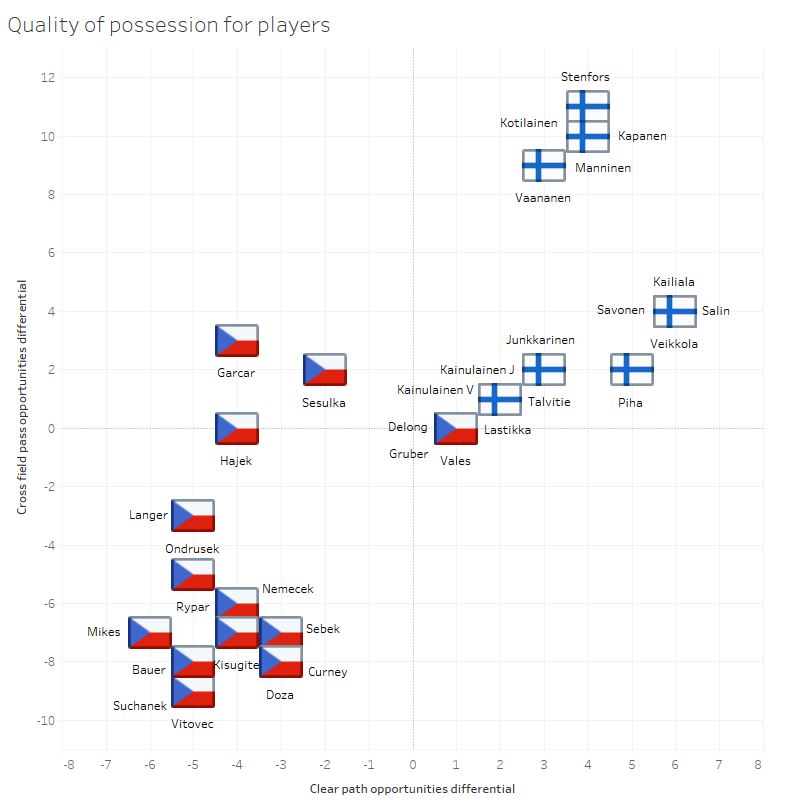
We selected two variables for players in the graph. Cross field pass opportunities differential being the first one and shown on vertical axis. First finnish line (Vaananen, Stenfors, Manninen, Kapanen, Kotilainen) was able to yield around 10 more cross pass opportunities in the game than their opponents. Garcar, Sesulka, Delong, Gruber, Vales and Hajek were able to post respectable numbers in that category for czech side too. Horizontal axis reflects clear path opportunities differential and finnish strength is apparent. Again Delong, Gruber and Vales were solid for the Czech republic in this regard.
When we look at shot attempts that corresponds more to activity in finishing plays we discover that third finnish line (Talvitie, Junkkarinen, Kainulainen J, Kainulainen V, Lastikka) has the most positive differential of 8. This statistics is called Corsi (found in ice hockey).
Petr Malina
News
1 - 20 / 146


WFC 2018 in facts and figures – 10.1.2019
Data Analysis: WFC Summary – 12.12.2018
Data Analysis: WFC Summary – 12.12.2018
Data Analysis: Finland vs Sweden 6:3 – 12.12.2018
Data Analysis: Sweden vs Switzerland 5:4 ps. – 11.12.2018
Data Analysis: Czechia vs Switzerland 2-4 – 11.12.2018
Final Day of WFC: Gold Goes to Finland, Silver to Sweden, Switzerland Takes Bronze, Czechs Again without Medal – 9.12.2018
Pascal Meier is the MVP of WFC 2018 – 9.12.2018
WFC 2018 All Star Team – 9.12.2018
Finland Beats Sweden 6:3 to Defend World Champions Title – 9.12.2018
Switzerland Overcomes Czech Republic to Win Bronze Medals – 9.12.2018
Another spectator record broken! – 9.12.2018
Data Analysis: Czech Republic vs Finland 2-7 – 9.12.2018
Latvia Beats Germany to Earn 5th Spot – 9.12.2018
Norway Again Outplays Denmark to Finish in 7th Place – 9.12.2018
DAY 9: Grand Finale Is Here! New Champions to Be Crowned Today! – 9.12.2018
Day 8 Summary: Sweden and Finland in Final Again, Switzerland and Czech Republic to Play for Bronze – 9.12.2018
Sweden Becomes Second Finalist after Thrilling Shoot-out Win – 8.12.2018
Finland Defeats Czech Republic Thanks to Brilliant Scoring Efficiency – 8.12.2018
Germany Beats Denmark 4-2 to Fight for 5th Place Tomorrow – 8.12.2018