Analysis: Does winning matter to you? So does for data analysts. – 16.10.2018
During last two years there were comprehensive data collected from floorball games from Tipsport Superliga (Czech elite league). There were Euro Floorball Tour games from Pardubice added as input for the analysis. There is one question that is of a big interest of many. In fact this question should be the most relevant for every sport data analyst.
What actions that can be measured from the game are those connected to winning?
Despite respectable sample size it is still not possible to answer the question with statistical significance but now it shows the direction in which data collection in floorball should be headed.
Variable / Measure | No. of games tracked |
Shot attempts differential | 28 |
Share of blocks differential | 28 |
In close shot attempts differential | 28 |
Goal estimation differential | 25 |
Shot attempts from turnover differential | 16 |
Shot attempts from slow attack differential | 16 |
Shot attempts from breakaway differential | 16 |
Possession on offensive half differential | 13 |
Correlations of observed variables (listed in the table) with goal scored differential (which also determines the winner of the game) were tested. First, let´s give you little description of measures stated in the table:
Shot attempts differential = difference between shot attempts for home team and away team (e.g. value -8 means that away team had 8 more shot attempts in the game)
Share of blocks differential = difference between percentage of shots blocked by home team and away team (e.g. value -0,08 means that away team recorded 8% more blocks on all shot attempts against than home team)
In close shot attempts differential = difference between shot attempts from in close (the most dangerous area to shoot from) for home team and away team
Goal estimation differential = difference of goals scored estimated between home team and away team. This is calculated through percentages of goals scored from different areas of offensive half as well as difference in play (even strength vs power-play)
Shot attempts from turnover differential = difference between shot attempts for from turnover (created on offensive half for attacking team) situation for home team and away team
Shot attempts from slow attack differential = difference between shot attempts for from slow (or organized) attack situation for home team and away team
Shot attempts from breakaway differential = difference between shot attempts for from breakaway (both odd man rushes and quick attacks) situation for home team and away team
Possession on offensive half = difference between percentage of a team possessing the ball on offensive half for home team and away team
These are correlations found and put in the order:
-0,28 Goal differential and Shot attempts from slow attack differential
-0,22 Goal differential and Shot attempts from turnover situation differential
-0,22 Goal differential and Shot attempts differential
+0,03Goal differential and Goal estimation differential
+0,19Goal differential and Possession on offensive half differential
+0,32Goal differential and Shot attempts from in close differential
+0,73Goal differential and Share of blocks differential
+0,87Goal differential and Shot attempts from breakaway situation differential
First three correlations have a negative sign meaning that with increase of a measure goal differential decreases. In more understandable way, teams who record more shot attempts from slow attacks usually lose the game, for instance.
There are two main measures that proved to be significant to watch – share of blocks (correlation of +0,73) and shot attempts from breakaway (+0,87). These teams that finish games with a positive share of blocks result and/or positive shot attempts from breakaway results are usually the winners.
Let´s look at the data for both of these measures and see the correlation with our own sight.

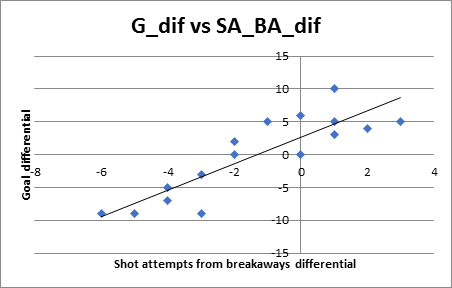
In both cases there is a visible positive correlation found. There is a bigger sample size for share of blocks variable (28 games) than shot attempts from breakaways (only 16).
Both seem to be of a great interest to track and evaluate in future floorball data analysis.
On top of this and inspired by work of Stephen Shea and Christopher Baker (Hockey Analytics, 2017) there were possession-based data collected for all three EFT men games in Pardubice. These measures includes different types of possessions (slow attack, quick attack, turnover and no attack) and also tracking clear paths, cross field passes and odd man rushes. Too early to evaluate by numbers but all these measures seem to be closely connected to winning as well. Tracking more games will only help this area of study. Those who are interested in deeper understanding of the game, those who are not satisfied with traditional statistics such as shots on goal should stay tuned and await or are very welcomed to take part in the future floorball data analysis.
Petr Malina
News
1 - 20 / 146


WFC 2018 in facts and figures – 10.1.2019
Data Analysis: WFC Summary – 12.12.2018
Data Analysis: WFC Summary – 12.12.2018
Data Analysis: Finland vs Sweden 6:3 – 12.12.2018
Data Analysis: Sweden vs Switzerland 5:4 ps. – 11.12.2018
Data Analysis: Czechia vs Switzerland 2-4 – 11.12.2018
Final Day of WFC: Gold Goes to Finland, Silver to Sweden, Switzerland Takes Bronze, Czechs Again without Medal – 9.12.2018
Pascal Meier is the MVP of WFC 2018 – 9.12.2018
WFC 2018 All Star Team – 9.12.2018
Finland Beats Sweden 6:3 to Defend World Champions Title – 9.12.2018
Switzerland Overcomes Czech Republic to Win Bronze Medals – 9.12.2018
Another spectator record broken! – 9.12.2018
Data Analysis: Czech Republic vs Finland 2-7 – 9.12.2018
Latvia Beats Germany to Earn 5th Spot – 9.12.2018
Norway Again Outplays Denmark to Finish in 7th Place – 9.12.2018
DAY 9: Grand Finale Is Here! New Champions to Be Crowned Today! – 9.12.2018
Day 8 Summary: Sweden and Finland in Final Again, Switzerland and Czech Republic to Play for Bronze – 9.12.2018
Sweden Becomes Second Finalist after Thrilling Shoot-out Win – 8.12.2018
Finland Defeats Czech Republic Thanks to Brilliant Scoring Efficiency – 8.12.2018
Germany Beats Denmark 4-2 to Fight for 5th Place Tomorrow – 8.12.2018