Data Analysis: Norway vs Finland 1-9 – 06.12.2018

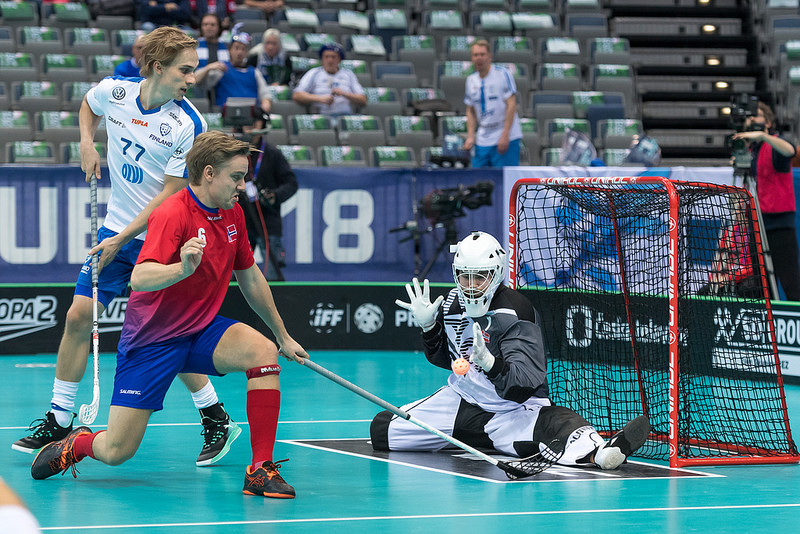
Sweden beat Norway 9-1 on Monday and Finland beat the same opponent by the same result just a day later. Data supports that both games were very different though.
Sweden was dominant in the game and especially in the first and third period had big advantage in clear path opportunities (more about Sweden vs Norway 9-1 here). 34-50 was shot attempt differential for Finland in the game and next graph is counting shot attempts during the whole game.
When we shift our focus to dangerous possessions we find out that Finland yielded more of these but that was a case mainly for the first period. Next graph reveals that.
2-5 was a difference in clear path opportunities created and Finland went to comfortable lead 0-3.
Similarly to Sweden vs Norway game the second period was the best one for Norwegian challenger. They had even significantly positive differential in clear paths (4-1) but failed to score here and Finnish players extended their lead by one goal.
Finland went on to control the third period as they did not let Norway to create much offensively. Themselves they kept scoring including three goals in last six minutes.
It was not that much of creating very dangerous situations in this game for Finland. It was also about quality of possessing the ball itself and not letting opponent to play. Creativity with the ball was apparent in the data when we look at cross field pass opportunities on offensive half.
Finland had 14 cross field pass opportunities and were able to score five times after cross field passing! Next gif is a good example that you don´t need to yield clear path (still it almost was) and still manage to have a pretty good look to score.
And yeah, Salin to Johansson for a goal. Strong teams are continuously looking for this kind of plays so your defence should be always aware of that.
We can get detailed on player level with what we know. Next graph helps us to find players (and lines) who liked to create these cross field passes the most.
There were two Finnish lines (names of player in upper right corner) dominant in this aspect. Not surprisingly these creativity on offence was connected to positive results of corsi. Corsi reflects offensive activity as it counts shot attempts for and against player´s team when on the field.
Last graph looks at active finisher of the game.
Lastikka dished 7 shot attempt assists for his teammates and with adding 5 shot attempts himself he was the most frequent finisher at even strength. Pylsy and Johansson S had the most shot attempts with 8. From Norway it was Valbye with 3 shot attempts and 3 assists or Gidske who focused on assisting in the game with 5 assists.
Can Finland add more danger for opponents to their quality control in their possessions? We shall see coming play-off time.
By Petr Malina
Useful info for fans coming to Prague – 10.9.2018
Data Analysis: Overview of the EFT in Pardubice – 7.9.2018
Data analysis: Czechs played quick and it paid off – 2.9.2018
Data Analysis: Second period not enough for Finland – 2.9.2018
Data Analysis: Finland in pure control over Czechs – 1.9.2018
Analysis: Slow attacks generate most goals but they are not the strongest weapon of winners – 29.8.2018
Media accreditation process launched – 22.8.2018
WFC 2018 Eshop launched! – 22.8.2018
Language lessons with Czech players – 6.8.2018
Floorball is coming to Prague – 20.7.2018
Enjoy WFC with your children, who have a big discount for VIP upgrade – 1.6.2018
Join the TEAM 2018 – 25.4.2018
Compete for World Championships Tickets during the Superfinal – 18.4.2018
Attend the Championship with a Bunch of Friends – 28.3.2018
Buy Your WFC Tickets Now – 15.3.2018
Test Your Floorball Knowledge and Win Tickets for the WFC – 14.3.2018
The World Championships to Start at a Cracking Pace! – 13.3.2018
Tickets for World Floorball Championships 2018 from March 15 – 6.3.2018
WFC 2018 Groups – 1.3.2018
WFC Prague Teams and Group Ballot – 27.2.2018


